
Kibana dashboards, from the Elasticsearch project, can help you visualise activity and incidents in log files. Here I show 3 different types of use cases for dashboards and how each can be used to answer different questions depending on the person. Video and details follow.
Text Search Dashboard
The first example is the simplest UI I could imagine: a query/search box, a histogram, and a table. In this instance any user, at any level of curiosity, can find textual data in the logs using a keyword match.

Then they can also see the relative number of records that occur at given times within the time window of all the data available. These are aggregate counts of all records that have some match to the query keyword or algebra.
Likewise, the table reflects the subset of data provided by the records, with the ability to only show fields of interest.
Process Details
A slightly more advanced use is to focus on a particular process (i.e. application) running on a machine that’s being logged. Here we can then take a particular metric, i.e. CPU usage, and graph it instead of just a simple histogram.

A typical user may be in charge of a particular set of services in a system. Here they can see how they perform and yet still dig into the details as desired.
I also do some cool “markers” to subtly show when events coincide with other process metrics.
All Events
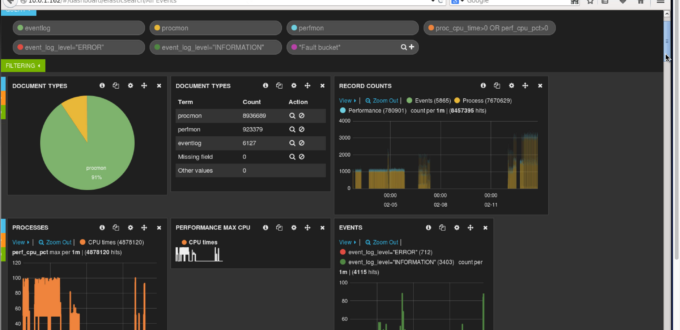
The data example shown here has process, performance and event logging information. I combine multiple queries and having them drive different parts of the dashboard – a pie chart, summary table, histogram, sparkline and other charts based on numeric data.

These can then all be filtered based on time windows that are interactively selected. This is really the typical picture of a dashboard – giving more densely packed information about a variety of metrics, ideal for system managers to get a handle on things.
Streaming Pipeline
The data are generated by Windows servers using a custom C# application that pushes data in a Kafka topic in a Hadoop cluster running in EC2. The data stream is then read from the topic using Actian DataFlow platform and pushed into Elasticsearch for Kibana to use at the end of the pipeline. There are other reasons I have this kind of pipeline – namely that DataFlow can simultaneously also feed other outgoing part of the pipeline – RDBMS, graph, etc. More on that in a future video/post.
Next Steps
- My next plans are to show you Kibana version 4 in action, replicating some of what I’ve shown here.
- If you haven’t seen it already, see this link and my video with some tips and tricks for using Kibana 3.
- Tell me more about your interests in dashboards and I’ll consider focusing on them too.
- Geography + Data - July 15, 2021
- DIY Battery – Weekend Project – Aluminum + Bleach? - January 17, 2021
- It’s all about the ecosystem – build and nurture yours - May 1, 2020
- Learnings from TigerGraph and Expero webinar - April 1, 2020
- 4 Webinars This Week – GPU, 5G, graph analytics, cloud - March 30, 2020
- Diving into #NoSQL from the SQL Empire … - February 28, 2017
- VID: Solving Performance Problems on Hadoop - July 5, 2016
- Storing Zeppelin Notebooks in AWS S3 Buckets - June 7, 2016
- VirtualBox extension pack update on OS X - April 11, 2016
- Zeppelin Notebook Quick Start on OSX v0.5.6 - April 4, 2016
Nice post. got introducted to Kibana recently. I think it is a ncie dashboard with much functionality.
I would be keen to know abouth its capability to
* analyse / display scientific timeseries, e.g. a timeseries of meterological data
* does it integrate with the scipy/pydata stack or common storage formats such as HDF5
* how can it show location-based information (timeseries on a map like folium: http://bl.ocks.org/wrobstory/5609803)?
Thanks and regards